Earthquake detectors measure hurricane turbulence

Figure 1.

Hurricane Isaac on 28 August 2012 shortly before making landfall in Louisiana as a Category 1 storm. Once on land, the storm passed over seismoacoustic monitoring stations, which captured seismic and infrasound data. Researchers recently analyzed those 2012 data and demonstrated how infrasound signals can be used to study hurricane turbulence.
(Image by Jeff Schmaltz, NASA, LANCE/EOSDIS Rapid Response.)

As a hurricane makes landfall, it shakes the ground beneath it. The shaking has historically been treated as background noise in seismic monitoring. Now, by analyzing both seismic waves and sound waves from a 2012 storm at frequencies below the threshold of human hearing, researchers have shown how instruments designed to measure earthquakes can be used to better understand the turbulence inside hurricanes. 1 Similar analyses could help improve hurricane simulations and storm prediction.
Turbulence data from from inside the hurricane boundary layer, the atmosphere’s lowermost region (the researchers specify its height as roughly 1–2 km) that exchanges energy, momentum, and moisture with the surface, can provide evidence as to how a storm converts kinetic energy to heat, which can influence storm intensity. Those data are often sparse, however, as the usual methods of flying aircraft directly into storms or using portable weather towers are dangerous and require manual deployment, respectively.
Qing Ji, then at Stanford University, and colleagues turned to seismic and infrasound monitoring stations from the NSF-funded USArray Transportable Array network, which in 2012 included about 400 stations spaced 70 km apart across the contiguous US. The team looked at data captured in August 2012 by stations located under Hurricane Isaac. The hurricane, shown in figure 1 , made landfall in Louisiana as a Category 1 storm and resulted in severe flooding and more than $2 billion in damage across several states.
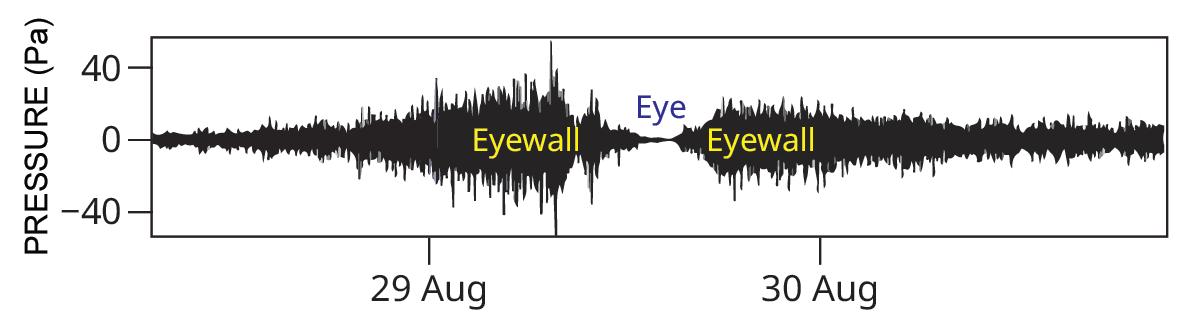
The stations’ microphones recorded infrasound signals of atmospheric pressure fluctuations, which were caused by the transport of atmospheric eddies in the HBL by the storm’s high-speed winds. The stations’ seismometers also logged weak ground shaking, which was caused by the pressure fluctuations displacing the ground at the sensor location and by distant hurricane-stirred ocean waves that pounded the seafloor. The pressure data, plotted in figure 2 , show that the fluctuations increased as the most intense part of the storm, the eyewall, passed by but fell steeply when the calm eye passed over.
Figure 2.

A seismoacoustic monitoring station in Louisiana captured infrasound pressure measurements on 28–30 August 2012 as Hurricane Isaac approached, passed close to the station, and departed. The data gave researchers insights into the turbulence in the lowest layers of the storm.
(Figure adapted from ref.
1
.)

Using the frequency patterns found in the pressure measurements, the team calculated the turbulent dissipation rate, which describes how energy is exchanged between eddies of different length scales within the HBL. The result was comparable to those measured by portable weather towers and by simulations. The team also determined that the origin of the turbulence was well within the HBL, about 100–200 m above the monitoring stations.
The work demonstrates the potential use of seismoacoustic monitoring stations to provide continuous, accessible measurements of events beyond earthquakes. Next steps include seeing if seismoacoustic sensors can measure less powerful storms. The team is also investigating how stations can be used to detect atmospheric inertia-gravity waves, which are key drivers of global wind patterns.
Reference
1. Q. Ji, I. Dey, E. M. Dunham, “Turbulent seismoacoustic imprints during a hurricane landfall ,” Science 393, 628 (2026).